Display Tab
The Display Tab is the second tab of functions that appears when working with a Task Cost Summary (not to be confused with the Task Cost Summaries Tab).
Navigation
Modules > Financials > Cost Analysis > Task Cost Summaries > Display Tab
Display Tab
The Display Tab is comprised of two groups of functions relating to the display of the Task Cost Summary:
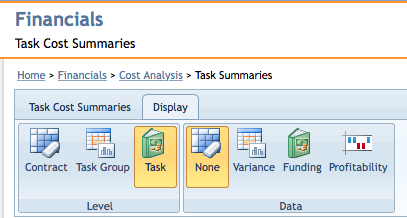
The Display Tab of the Task Cost Summaries Ribbon Bar.
Level
Each of these functions allow Tasks to be grouped in different levels in a Task Cost Summary.
- Contract
- Displays Tasks on a Contract level. (Highest level - only one value displays)
- Task Group
- Displays Tasks on a Task Group level.
- Task
- Displays Tasks on the Task level. (Lowest level - each Task is displayed individually)
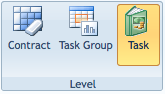
The Level group of functions, found under the Display Tab.
Data
Each of these functions allow additional data to appear in a Task Cost Summary.
Note: each these functions are all exclusive, meaning that only one may be toggled at any point. However, the four main columns (found in the description of "None") display no matter which option is selected.
- None
- Displays only the four main columns:
- Actual Dollars for Current Financial Month
- Planned Dollars for Current Financial Month
- Actual Dollars for the Contract-To-Date period
- Planned Dollars for the Contract-To-Date period
- Variance
- In addition to the four main columns, selecting this will display the following Variance data:
- Variance (in dollars) for the Financial Month displayed
- Variance (percentage) for the Financial Month displayed
- Variance (in dollars) for the Contract-To-Date period
- Variance (percentage) for the Contract-To-Date period
- Funding
- In addition to the four main columns, selecting this will display the following Funding data:
- Approved Funding through the selected Financial Month
- Financial Month Commitments
- Remaining Funding through the selected Financial Month
- Funding Burn Rate
- Profitability
- In addition to the four main columns, selecting this will display the following Profitability data:
- Invoiced Dollars for the selected Financial Month
- Net Profit Margin for the selected Financial Month
- Invoiced Dollars for the Contract-To-Date period
- Net Profit Margin for the Contract-To-Date period
- To enable/disable Profitability Reporting, navigate to Admin > Settings > Financials Module Settings > General Settings > Enable Profitability Reporting
Color Coding
Additionally, selecting either the Variance or Funding views will reveal a color coding system that reflects aspects of the financial health of each Task at any given level.
Funding
- Red highlighted rows indicate a cost overrun situation in the Contract-To-Date in Actual Dollars column.
- This threshold can be defined by navigating to Admin > Settings > Financials Module Settings > Funding Display
- Red square in the Remaining Funding column indicates critical funding for the Task.
- Yellow square in the Remaining Funding column indicates a funding warning for the Task.
- Green square in the Remaining Funding column indicates that funding is OK for the Task.
Variance
- Red highlighted rows indicate that the Task is outside of the tolerable Variance threshold
- This threshold can be defined by navigating to Admin > Settings > Financials Module Settings > General Settings > Threshold for Variance Alert
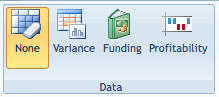
The Data group of functions, found under the Display Tab.
Page ID:3956-4905-3910